General Items of Interest
About the River Cam
- Directions to the college boathouse and the river
- Map from Trinity to Baits Bite Lock
- Rowing -> the Bumps -> the Bumps course - including advice for spectators
The River's Catchment Area
| |||||||||||||||
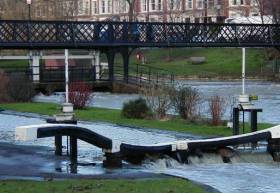
The River Cam is about 40 miles long and where it flows through Cambridge it is supplied by a catchment area of size 761.5 km² - equivalent to an area about 17 miles square. It is navigable as far as Cambridge - the water level being carefully controlled by a series of weirs and locks.
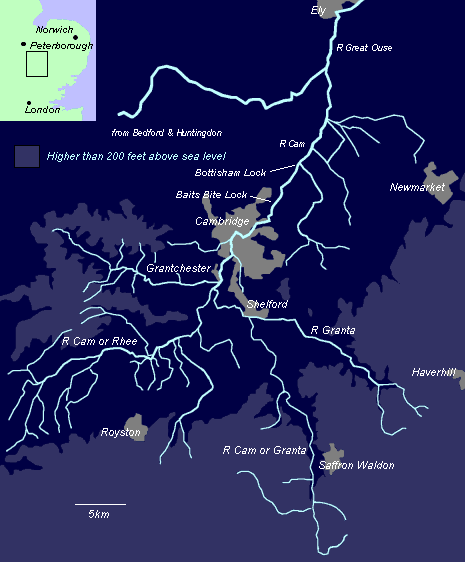
The river water, draining from land which rises to 168 m at its highest point, falls to 5.2 m above sea level by Jesus Lock. Sited at the North East edge of the city centre, this is the upstream end of the stretch of water used by college crews. The next two locks are Baits Bite Lock, three miles to the North East, and Bottisham Lock, which is around five miles from Jesus lock to the North North East. Bottisham Lock marks the downstream limit for college crews. By this point the catchment area has grown in size to 803 km² and the altitude of the river fallen to just 2.4 m.
The Cam's tributaries (the Rhee and the Granta) and its merging with the Great Ouse before reaching Ely are shown in the map below - taken from the 1:250,000 Ordnance Survey maps. The River Granta, from which the discontinued University men's lightweight's 2nd crew took its name (Granta) between 2000 and 2006, can be seen rising to the South East of Cambridge.
The River's Flow
The flow of water in a river (known as "the stream") can often affect the outcome of races - and during periods of high rainfall even on the river Cam.
The National Water Archive have supplied details of the flow rate of river water at Jesus Lock. The graph below shows monthly flow rate averages (in cubic metres per second) between 1960 and 1983, after which the monitoring station there closed.
The different regions of the chart show the different quartiles of the monthly averages - with the top and bottom edges of the data being the maximum and minimum monthly averages measured during this period.

The daily averages, which have not been included here, show much higher peaks, of course; the data report a daily average flow rate which peaks at 36 m³/s, on the 6th May 1978 - a day which saw floods rivalling those of February 2001. By my calculation that would total about 3 million tonnes of water in the 24 hours.
Some Interesting Links
- Cam Roots and Routes - more about the history and tributaries of the river
- Cam Conservators - the navigation authority between Bottisham Lock and the Mill Pond in the centre of Cambridge
- Complete map of rivers in the East Anglian region